
Systems Medicine: Physiological Circuits and the Dynamics of Disease by Uri Alon
Starting from basic laws, the book derives why physiological circuits are built the way they are. The circuits have fragilities that explain specific diseases and offer new strategies to treat them.

While I won’t always actually outline the equations/math in the textbook, it’s worth going through the basics yourself to build intuition.
Systems Medicine by Uri Alon can be thought of as Thinking in Systems by Donella meadows applied to biological processes. Uri Alon was theoretical physics PhD before he got into biology. With his gift for back-of-the-envelope systems modeling, he’s spent two decades leading world-class teams in systems-level research to uncover the functional reasons behind health and biological unknowns. He creates mathematical models to generalize circuits for insulin-glucose regulation, thyroid function, stress responses, inflammation/fibrosis, and the behavior of stem and senescent cells.
Alon uses these circuits to develops what he calls a “periodic table of diseases,” akin to the periodic table of elements, highlighting fascinating parallels between systems medicine and other fields. Just like any system, the math in the book produces equations with parameters and graphs that help us create circuit-level approaches to asking fascinating new questions about medicine. We find that occurrences that seem random or unexplained often have functional roles within this framework.
Via his unique approach, Alon is inspired by to treat aging as a whole, rather than focusing on individual diseases, could mark a significant turning point in medicine. However, while the research is incredibly promising and has found incredible results when tested on mice, translating these findings to human applications will take considerable time due to the lengthy nature of in vitro and in vivo experiments and the nature of regulations.
Full outline with images from the textbook here.
Part I: Hormone Circuits
Chapter 1: The Insulin-Glucose Circuit
Glucose concentration and dynamics is tightly controlled
Glucose concentration in the blood is maintained within a tight range around 5 mM (‘5 millimolar’)
Steady-state varies by only ~20% in healthy individuals via homeostasis
< 3mM → brain doesn’t have enough energy and we faint
> 7 mM → glucose damages blood vessels by sticking to them, causing type 2 diabetes, heart attack, kidney disease, blindness, amputating arms and legs etc
Glucose between 5.6 and 6.9 mM is prediabetes
Above 6.9 on two separate tests means diabetes
Glucose tolerance test (GTT): you drink 75 g of glucose and measure blood glucose in the following 2 hours. Glucose rises to about twice its basal level of 5 mM, and then falls back to baseline in about 2 hours
Glucose concentration is controlled by insulin
Glucose
Unable to enter cells without special glucose transporters in the cell
Found in body via eating food; by being stored in the liver as glycogen; or when the body runs out of glycogen, via amino acids taken from muscles in a process called gluconeogenesis (variable m)
Insulin
A small protein which circulates in the blood
Beta cells
Secrete insulin when they sense glucose in the blood
Found in the pancreas in the Islets of Langerhans, which also contain alpha cells
Alpha cells secrete glucagon, which increases glucose in the blood by inducing the liver to produce glucose during sleep
How insulin helps move glucose from the blood to the cell
Insulin binds to insulin receptors like a lock and key → the cell moves glucose transporters from within the cell to the cell surface → glucose moved from the blood into the cell
Diabetes is a malfunction in this system
In type-1 diabetes (T1D), the immune system attacks beta cells and kills them off.
Treated via insulin injections or continuous insulin pumps
In type-2 diabetes (T2D), glucose rises over the years and causes damage to the body. A major cause of type-2 diabetes is insulin resistance
To learn more watch this video
Insulin sensitivity (variable s)
The effect of a unit of insulin on glucose removal rate
Measured by injecting insulin and observing the subsequent reduction in glucose
Insulin sensitivity varies between people and over time
B/c it is a physiological knob that allows the body to allocate glucose resources and determine which tissues get the glucose
For example: when we exercise or during caloric restriction, we need to use or store glucose, and signals are secreted that cause insulin sensitivity, s, to rise
The effect of insulin is magnified by higher s, and muscles and fat take up more glucose from the blood.
Meaning a single insulin becomes more effective at removing glucose from the blood
Even though people vary in s by as much as a factor of 10, most people have normal glucose levels and dynamics
Ex: most people with obesity, which all have low s, have normal 5 mM glucose and GTT dynamics.
Insulin resistance (1/s)
The extent to which insulin fails to work
Inflammation, pregnancy, chronic stress, and obesity lead to insulin resistance (low s)
Pregnancy diverts glucose to the fetus
Chronic stress releases the hormone cortisol
Obesity causes fat to accumulate in muscle and liver, thereby triggering inflammation
Mathematical model for the glucose-insulin circuit
Rate of change of insulin = dI/dt = production-removal
The half-life is inversely related to the removal rate – faster removal leads to shorter half-life
Thus, half-life is not affected by any of the production parameters like q and f(G) or by initial conditions.
A rapid glucose removal rate creates a wasteful cycle of high production and high removal. To avoid this wasteful cycle, the body uses insulin to increase the removal rate of glucose when needed
Insulin is made only when glucose is high. This provides a high removal rate after a meal and a low removal rate during fasting
Notably, since insulin is made in tiny amounts compared to glucose, the cost of the insulin system itself is negligible.
The minimal model we build in Ch1 needs additional mechanisms to explain how glucose stays under tight control despite variations in physiological parameters like insulin sensitivity/resistance
Chapter 2: Dynamical Compensation, Mutant Resistance, and Type-2 Diabetes
Three laws of physiology
Law 1: All cells come from cells
Law 2: Biological processes saturate
Law 3: Cells mutate
+ the force of natural selection
Since physiology was tuned by natural selection in the prehistoric environment, modern conditions can trigger mismatches that lead to disease
Endocrine organs face 3 universal challenges
(1) Work precisely even though they communicate with distant tissues that have unknown parameters that change over time (robustness to parameter variations)
(2) Maintain a proper organ size, even though cell populations tend to grow or shrink exponentially (organ size control)
(3) Avoid harmful mutant cells that can overgrow and take over the organ (mutant resistance)
What are endocrine organs?
Endocrine organs secrete hormones that flow in the bloodstream and communicate with distant tissues
The way that the body compensates for insulin resistance is by making more insulin
Hyperplasia (more cells) + hypertrophy (bigger cell) increase the total mass of beta cells, which means more insulin production
Hypertrophy is the dominant cause in humans after childhood
Lean people have more efficient and fewer # of beta cells, obese people have less efficient and greater # of beta cells
It’s like factories making cars. To make more cars, one can increase production from each factory – but only up to a limit. Beyond that, more factories are needed.
Beta-cell mass and insulin resistance phase portrait
(1) Insulin resistance shifts the blue nullcline and raises the fixed point to higher glucose (2.1)
(2) Long-term excess glucose over weeks causes beta-cell mass to gradually increase.
In this compensated state, insulin secretion is higher than in the original setpoint, due to the enlarged beta-cell functional mass
BC each insulin is less effective, this is how you make more to do the same job of keeping glucose at a given point (5 mM)
Essentially, excess glucose is OK for short-term, but in the long-term it leads to beta cell mass to increase
Healthy people show an inverse hyperbolic relationship between insulin sensitivity (s) and steady-state fasting insulin (I)
Two things to note
Inverse: negatively correlated
hyperbolic means non-linear: thus, rate of change is not constant + a small change in s can lead to larger changes in I
A slow feedback loop on beta cell mass provides compensation
Dynamics of cell populations…
Cells have exponential growth. Cells increase their biomass and divide (proliferate) at rate p and are removed at rate r
Removal rate includes active cell death (apoptosis), exhaustion, dedifferentiation, and senescence
Production rate is autocatalytic
Self-catalyzing means the product of the reaction helps speed up the reaction itself
Net growth rate (μ) = p - r
If production exceeds removal, net growth rate is positive and total cell mass rises exponentially, B ~ eμt
Cancer
If removal exceeds production, net growth rate is negative and it decays to 0
Degenerative diseases
The problem of organ size control! It is hard to keep total cell mass constant over time… enter LAW 1…
Note: this is NOT like the dynamics of protein concentrations inside cells or molecules in the blood.
Law 1: All cells come from cells
~1M cells are made and removed every second. ~100 g of tissue per day
We need feedback control to balance growth and removal – to reach zero net growth rate (μ= 0) and keep the organ at a good functional size
Otherwise we explode or collapse with exponential systems
Organ size control in beta cells is provided by feedback from glucose
Removal rate is high at low glucose and high glucose (latter known as glucotoxicity)
We’ll use rate plots to understand tissue-level circuits by plotting production and removal rates
The crossing point of the curves is the steady state, where cell production equals cell removal & total cell mass does not change
Or use net growth rate for a single curve
These stable dynamics (stable at 5 mM) are indicated by the arrowheads pointing into the fixed point
Due to the steepness of the removal curve, variations in growth rate (black curves) do not shift the 5 mM fixed point by much
Feedback loops can have different time scales
Beta-cell/insulin is over weeks (slow feedback loop), whereas insulin/glucose is over minutes/hours
The cell mass feedback circuit maintains homeostasis despite parameter variations
BIG model stands for the Beta-cell-Insulin-Glucose model
2.2 and 2.3 are from Ch1.
2.4 is simply: total beta-cell mass (B) * growth rate function given a glucose level
Steady-state is in two cases
When B = 0, but that means you have no beta cells and thus produce NO insulin
When μ(G) = 0, which happens when G = 5 mM glucose… which is healthy!
Integral feedback loop: accumulated sum of the errors from the desired setpoint and the actual output over time
As glucose deviates from the setpoint, the system can allocate insulin to it properly
Beta-cell mass expands or contracts to precisely buffer out the effects of parameter changes.
Parameters: maximal insulin production per beta cell (q), insulin removal rate (γ), and even the fasting supply of glucose by the liver (m)
Beta-cell mass varies inversely with insulin sensitivity
B grows when s is small
The same circuit design appears in many hormone systems (just replace Glucose, Beta-cells, and Insulin) → A Circuit Motif
Negative vs positive feedback loop
Negative Feedback Loop: reduces fluctuations, promotes stability
Home thermostat bringing temperature back to 70 F; insulin-glucose circuit
Positive Feedback Loop: amplifies changes, promotes instability
Microphone and speaker feedback makes noise louder
The circuit also makes the dynamics robust
Rheostasis: enables the body to adapt to different situations by shifting set points or ranges as needed
During a fever, the body temporarily raises its temperature set point to fight infection
Whereas homeostasis keeps it at 37 C normally
Dynamic compensation (DC): Starting from steady state, the output dynamics in response to an input is invariant with respect to the value of a parameter.
The system adapts to maintain consistent performance despite changes in certain parameters
Suppose that insulin sensitivity drops by a factor of 2
In the new steady state, there is twice the mass of beta cells and twice as much insulin. Glucose returns to its 5 mM baseline.
There is a middle (transient) point where the system has not realigned via dynamic compensation
Glucose dynamics in response to a meal are abnormal only during the transient period of days to weeks in which beta-cell mass has not yet reached its new, compensatory, steady state (timepoint 2).
Dynamic compensation allows people with different insulin sensitivity (s) to show the same glucose meal dynamics.
So how and why do things break down if this circuit is robust?
Prediabetes is a due to an upper limit to beta-cell compensation
Prediabetes has no symptoms and occurs in 1 of 3 Americans, though 80% don’t know that they have it.
It is dangerous because people with prediabetes transit to type-2 diabetes at a rate of about 10% per year.
Law 2: Biological processes saturate
In adulthood beta cells stop dividing, compensation by increasing the amount of insulin they secrete per biomass as well as the size of each beta cell
Like many conditions, prediabetes can result from many parameters change that could cause beta-cells to hit their insulin production carrying capacity and doesn’t let them compensate for the increased glucose in blood
Diabetes drug metformin lowers liver production of glucose and thus lowers m
Exercise raises s
A few other pathways to diabetes
A rapid rise in insulin resistance that is too fast for beta cells to grow and catch up
Pregnancy’s gestational diabetes: Insulin resistance rises due to signals secreted from the placenta in order to direct glucose toward the fetus , leaving the mom’s cells without enough insulin to remove glucose from the blood
Type-2 diabetes is linked with instability due to a U-shaped removal curve
Glucotoxicity: we know that glucose at high levels disables and kills beta cells. When patients lose their beta cells, they can’t make enough insulin
Vicious cycle of glucotoxicity
The unstable fixed point is the point at which proliferation rate crosses removal rate a second time
This plot explains several risk factors for T2 diabetes
A diet high in fat and sugars: makes it more likely that glucose fluctuates to high levels, crossing into the unstable region
Aging: as we grow older, the growth rate of cells drops in all tissues including beta cells. This means that the unstable fixed point moves to lower levels… easier to cross into the unstable region
With age the glucose set point mildly increases in healthy people
Genetics: a shifted glucotoxicity curve can make the unstable fixed point come closer to 5 mM
Why is a dangerous effect like glucotoxicity not removed by natural selection?? — some believe its a mistake… We take the point of view that it has an important physiological role. Let’s examine a case of mutant beta cells
The circuit is fragile to invasion by mutants that misread the input signal
Mutant cells arise when dividing cells make errors in DNA replication → mutations
Law 3: Cells mutate
Ex: Mutation in beta cells
In glycolysis, we modify glucose chemically via an enzyme called glucokinase
A mutation that affects the binding constant K of glucokinase, reducing it, say, by 5x, causes the mutant beta cell to missense glucose concentration as if it were 5x higher than it really is.
It would think “Oh, we need more insulin!” and proliferate. Then, it has a growth advantage over other beta cells, which sense 5 mM correctly
Property 1: there will eventually be a substantial population of mutant beta cells, which produces a lot of insulin, attempting to push glucose down to a set-point level that they think is 5 mM, but in reality is 1 mM, which is lethally low glucose
Property 2: normal cells begin to be removed because their removal exceeds proliferation
Biphasic (U-shaped) response curves can protect against mutant takeover!
Biology needs special designs to prevent takeover by mutant cells by giving mutant cells a growth disadvantage
Remember glucotoxicity: glucose at high levels kills and disables beta cells
So when a mutant cell misreads glucose as very high, it kills itself
There is thus a tradeoff between resisting mutants and resisting disease
Still there’s vulnerability to intermediate mutants
Cells that misread 5 mM glucose as a slightly higher level that lies between the two fixed points (5-25 mM, see below)
Have a growth advantage, because they are too weak to be killed by glucotoxicity and have higher production than removal rate
Designs against intermediate mutants
Beta cells arranged in isolated islets of ~1000 cells in pancreas
Because they're isolated, a mutant would not take over the entire organ.
The glucotoxicity mutant-resistance demonstrates a mechanism that can be generalized to some (though not all) other organs: to resist mutant takeover of a tissue-level feedback loop, the feedback signal must be toxic at both low and high levels
U-shaped phenomena like this are called known as biphasic responses bc their curves have a rising and falling phase
Again… comes at the cost of fragility to dynamic instability and disease
In exponential systems (really anything that is non-linear), you need checks and balances at lows and highs to keep the system at a stable point. This is why the same indicator (glucose levels in blood) can be responsible for both killing and creating new cells!
Chapter 3: The Stress Hormone Axis as a Two-Gland Oscillator
The HPA axis responds to physical and psychological stress
Cortisol
Cortisol is a a small fat-like molecule, a steroid hormone which prepares our body for physical and psychological stress
Because it is fatty, it can penetrate the membranes of all the cells in the body and bind to cortisol receptors
When we wake up, we get a boost of energy thanks in part to a morning surge of the hormone cortisol
Similar surge if we see a threat or even if we predict that a threat is coming (psychological stress)
Cortisol increases blood pressure, releases sugar into the blood, focuses the mind, and gets us ready for fight or flight.
It takes minutes to act. Stresses also activate faster responses within seconds
The sympathetic nervous system and secretion of adrenalin that makes our hearts beat fast and the liver secrete glucose.
The HPA axis
Hypothalamus (H) - midway between our ears
Activated by emergencies and stresses
Regulated by the brain’s circadian clock to generate the morning surge of cortisol and to keep cortisol low at night.
Output: hormone CRH (corticotropin-releasing hormones, x1)
Pituitary (P) - a pea-sized organ at the bottom of the skull
Output: hormone x2 (ACTH, adrenal cortex trophic hormone) + beta-endorphins
Endorphins Endorphin means “endogenous morphine”, and we know morphine is a pain killer
Adrenal Cortex (A) - there are two adrenal glands, pyramid-shaped tips on top of the two kidneys
“Cortex” refers to the outer layer of the adrenal gland.
Output: cortisol
Cortisol closes a negative feedback loop by inhibiting the rate of production and secretion of its two upstream hormones, x1 and x2
Stress
Sudden stress → acute response
Cortisol levels rise from their normal range of 100–300 nM to nearly 1000 nM
Lasts about 90 minutes, the halflife of cortisol
Weeks of stress → Chronic stress
Symptoms: Weight gain, high blood pressure, risk of heart disease, diabetes, bone loss, and depression and other cognitive changes like anxiety and decreased learning
Deep breaths relax the fast sympathetic nervous system for fight and flight and activate its counter system called the parasympathetic nervous system for rest and digestion.
The classic model for the HPA axis explains responses on the timescale of hours, but not on the timescale of months
The adrenal grows upon prolonged stress
The dynamical consequences of these gland-mass changes have not been considered mathematically until recently
The HPA axis shows a feedback loop in which two glands control each other’s size
P and A cell mass are, just as in the case of beta cells, the difference between cell proliferation (hormone-dependent growth rates) and removal (cell removal rates)
Cells of the A and P glands proliferate and are removed with a typical turnover time of about 1–2 months
The textbook fast time scale for the hormones describes in the minutes/hours is more accurately described quasi-steady state
As in the case of glucose, the circuit protects cortisol baseline levels from variations in many physiological parameters, compensating for these changes by means of slow growth and shrinkage of the glands.
Reminder: in glucose, it was growth/shrinkage of beta-cells, which control insulin
Again we see Rheostasis
The pituitary and adrenal glands form a negative feedback loop that can oscillate with a seasonal timescale
Look at how ‘P’ and ‘A’ become ‘p’ and ‘a’ over the cycle and the time it takes
The overall time for a full cycle is on the order of a year
A year is important for organisms because of the changes in seasons.
It’s useful to have an internal oscillator that can keep track of seasons
Position and velocity acts like an oscillator, not a sustained one but a dampened one
There is a negative feedback loop between velocity (v) and position (x)
Suppose the mass is at rest at its equilibrium point. If you pull the mass down, the spring will stretch and exert a force pointing back to the equilibrium point. If you let go of the mass, it will return to equilibrium but with high velocity v, so it will overshoot and compress the spring. The compressed spring pushes the mass back down, and so on, to obtain sustained oscillations
The honey causes a drag force which is proportional to velocity
The spring does not oscillate forever but instead settles down to its equilibrium point.
Damped oscillations in steroid withdrawal over months
High doses of steroids for a few days cause no problems.
If they are given for 2 weeks or more, it is important not to stop steroid treatment all at once.
Steroid withdrawal - A sudden stop can make the patient show dangerously low cortisol. The adrenals can’t make enough cortisol, causing serious symptoms: blood pressure drops to potentially fatal levels
When external cortisol is added, both P and A glands shrink bc they “think” there’s too much cortisol
Recovery from prolonged stress takes weeks and shows an endorphin undershoot
Prolonged stress occurs in periods of severe disease, starvation, psychological anxiety or depression; as well as periods of alcoholism or drug abuse
See how steroid withdrawal is easy to read out (blue trajectory) by following the arrows: first P grows, then A, and then a spiral back to the fixed point
After stress, illness or addiction, it takes weeks for the adrenal to return to normal, and the pituitary shows an undershoot
→ As a result, it takes a month or so for cortisol to go back to normal.
There is a longer period of low x2, which means low levels of the natural painkiller and euphoric beta-endorphin
Low beta endorphins can cause dysphoria – a reduced ability to enjoy pleasurable stimuli and an increased sensitivity to pain.
We need care and compassion in the months when people recover from prolonged stressors.
Seasonality in hormones
Signals for the seasonal cycle are day-length variation, shortest in midwinter and longest in midsummer
Short days are a kind of stress input. Day length affects a brain hormone called melatonin, which feeds into the P gland.
Human hormone seasonality is controlled by the HPA axis
(1) Peak cortisol should not occur at the time of peak input (December 21) but rather be delayed by about 2 months. This is a spring-shift in cortisol.
(2) Cortisol and x2 (ACTH) are in approximate antiphase, with x2 peaking in late summer/fall.
How the study to confirm these results was done
Using big data from EHR records in Israel provided by largest insurer (Clalit)
There is Ascertainment bias – medical tests are done for a clinical reason, as opposed to a uniform sample of the population.
→ filtered out data from people with medical conditions that can confound the results.
Winter blues
The seasonal variation in the HPA axis may contribute to mood disorders
SAD is common at high latitudes, with 10% prevalence in Alaska versus 1% in Florida.
So... core variable in seasonal sadness is apparently not about sun, but the length of a given day??
The two-gland feedback loop design of the HPA axis appears also in other hormonal systems controlled by the hypothalamus and pituitary
These “HP” axes control reproduction, growth, and metabolism
Perhaps there is a peak season for reproduction, growth, and stress response…
Although modernity makes seasons less impactful, perhaps there is a season for every purpose.
Bipolar disorder has a timescale of weeks-months and this timescale can be generated by gland size fluctuations
Alon proposes a theory on bipolar disorder being affected by cortisol and the HPA axis
HPA Axis dysregulation and cortisol
Bipolar disorder involves HPA axis dysregulation with elevated cortisol levels, doubling the average levels found in undiagnosed individuals.
High cortisol can cause mood episodes, often preceding bipolar episodes.
Emotional hyper-reactivity in bipolar patients leads to larger stress responses and sustained high cortisol.
Mechanism and model for Bipolar Disorder
The HPA feedback loop amplifies stress inputs, causing significant cortisol fluctuations over months.
Noisy stress inputs cause erratic oscillations in HPA gland sizes and hormone levels, akin to a spring in a fluid on a bumpy road.
A drug which reduces cortisol may help treat bipolar disorder and be generally helpful for people in chronic stress
My own thoughts: that’s a surface level approach. If the root of the problem isn’t solved, it will create reliance on drugs
The HPA Circuit suggests drug targets to lower cortisol
Via a “circuit-to-target” approach, we systematically change each model parameter and look for those that can lower steady-state cortisol.
The HPA model can explain the failure of most drugs (receptor inhibitors, hormone production inhibitors or hormone analogous)
Most of the possible drugs would not work because of compensation!
Bc of the robustness of cortisol steady state, the glands change their size to compensate fully leading to no change in cortisol
Example: blocking the cortisol receptor actually makes the adrenal gland grow and release more cortisol, exactly compensating for the blocking of its receptors. The drug works for a few weeks, but once the circuit compensates it stops working
So what may works: reduce the long term cortisol steady state
We see only drugs that affect the output of the hypothalmus (CRH) actually matter
Reduce Pituitary cell growth rate → inhibit CRH-receptor
How?
Inhibiting the CRH-receptor in P cells using a receptor antagonist.
Remember, CRH is released by Hypothalamus, but Pituitary cells use it to send out ACTH
Increase Pituitary cell removal rate → increase CRH removal rate
How?
Use antibodies that bind and block CRH
Without a circuit model, we run the risk of developing the wrong drugs
4 hours, 22 pages
Chapter 3.5: The Thyroid and It’s Discontents
There are 4 hypothalamic-pituitary axes, or HP axes, that control pillars of life – growth, reproduction, stress, and metabolism
HP-thyroid axis, or HPT axis controls metabolic rate
Had many autoimmune diseases - diseases in which the body attacks itself
The HPT Axis is designed to keep a steady level of thyroid hormone T4 (hence it’s analogous to glucose and cortisol)... Some thyroid facts:
Shaped like a butterfly
Thyroid secretes thyroid hormone, T4, that affects all cells and has far-reaching effects on the heart and on metabolism
Goiter - excessive growth of the thyroid, which
Occurs when iodine, essential for making T4, is low in the diet, as in areas far from the sea which in old times lacked access to the iodine in seafood
TSH is a better indicator than T4 of future disease
High TSH makes the thyroid grow by up to a factor of 10 — like a small melon at the throat
Having abnormal TSH and normal T4 is a subclinical disease, meaning there is typically no symptoms but it’s a warning sign
Structure function relation in the HPT circuit
Why is the circuit design different?
Each system needs to performs homeostasis for a different function
We need T4 to be nearly constant
Free range is 10-20 pmol/L, and healthy individuals vary over time by about 50% of this range around their own personal set point.
Hence T4 steady state is robust to changes in all other physiological parameters
We need cortisol to be flexible to stress inputs, hence there’s a wide range for the HPA axis
Circuit structure matches function
How is thyroid hormone (T4) produced?
Chemistry refresher: each of the carbon rings is represented by a hexagon with three double lines that has 2 iodine atoms attached to it
T3 is when one of the four idioms from T4 is removed by iodinase enzymes to be a more active form
Active form means it’s more potent for tissues/organs + it can bind to thyroid receptors more easily
Remember Tg (thyro ‘T’ – globulin ‘g’) and TPO (thryo ‘T’ – peroxydase ‘PO’) for future use
(1) Iodine comes into the cell. (2) Iodine and Tg exported to colloid outside. (3) Both to get binded by the TPO to form Tg (5) Tg imported into cell (6) Tg broken up into smaller T4’s and T3’s (7) Those are exported out of the cell into circulation
Hyperthyroidism and hypothyroidism
Hyperthyroidism - diseases with too much T4
Increases metabolic rate – you eat more but lose weight. Emotions and thoughts race, sometimes resembling mania. There is a feeling of heat and sweat, due to thermogenesis. Muscles hurt. The hands might shake due to effects on the nervous system.
Hypothyroidism - diseases with too little T4
Heart beats slowly, and you can be out of breath when climbing the stairs. You gain weight despite not eating more, with reduced appetite and constipation. Emotions tend toward depression. There is a clammy feeling of cold.
In infants → impaired development of the brain… thus TSH test at birth is important!
Hashimoto’s disease, a case of self-attack
Treated by supplying thyroid hormone in pills. The pills are taken for life since the autoimmune attack never allows the thyroid to recover. Most people live fine with these pills.
TSH shows a delay after hashimoto’s disease is treated
The origin of the delay is from changes of gland masses
T4 inhibits pituitary growth. Thus, low T4 allows means TSH from the pituitary will increase (at almost an exponential rate, see figure 3.5.5). Now we have an enlarged pituitary. Once our treatment starts, it takes 6 weeks for the pituitary to shrink back to its normal size, thus 6 weeks for TSH to return to its baseline too.
Subclinical Hashimoto’s is due to dynamical compensation
Hyperthyroidism due to toxic nodules: a case of a hyper-sensing mutant
Nodules are a clone of an original mutant cell with a mutation, forming lumps in various parts of the body.
In the thyroid circuit, it’s usually in the TSH receptor, that makes it more sensitive to TSH
They “think” that TSH is high so that it must divide and secrete more thyroid hormone.
It can be imaged by ultrasound, felt by touch, and seen to be active in secreting T4 by a radioactive iodine scan
Requires surgical removal
“Hot nodules” are called toxic nodules because they secrete T4
Occurs in about 1% of the population
“Cold nodules” do not secrete T4 and are 10x more likely than hot nodules to become cancerous
Cancerous means to spread to other body parts to form new tumors (metastases)
Why does the thyroid not have a biphasic mutant resistance mechanism? – like beta cells, where cells that sense too much glucose kill themselves?
Having biphasic regulation is based on: does the circuit have a required range of variation and compensation.
The higher the range, the less likely to have this regulation.
Unlike beta cells, the signal in the thyroid axis, TSH, varies over a 1000-fold range to compensate for physiological variation, such as iodine levels in the nutrition which can vary over at least a 100-fold range.
It would mean if iodine is low, thyroid cells would start killing themselves which would be lethal.
Why are there autoimmune diseases of hormone glands?
Why these particular cell types and not others?
Why do some endocrine organs and cells virtually never get autoimmune diseases?
Why is there no autoimmune disease that attacks alpha cells which secrete glucagon, only beta cells?
Why does the pituitary not get disease?
Part II: Immune Circuits
Chapter 4: Autoimmune diseases as a fragility of mutant surveillance
Introduction
We will deduce rules for which tissues get autoimmune diseases versus mutant-expansion diseases.
Type-1 Diabetes is a disease in which the immune system kills beta cells
Theory in this book is that it is the dark side of an important physiological process, not a failure of natural selection to eradicate individuals with self-killing immune cells
Origin of all these diseases is said to be “a combination of genetic and environmental factors” – shorthand for “WE DON’T KNOW”
Many endocrine organs have organ-specific autoimmune diseases
Two types of autoimmune diseases
(1) Systemic diseases that attack many organs
Ex: lupus, rheumatoid arthritis
(2) Cell-type-specific diseases
Executive summary of T-Cell biology
T-cells attack virus infected cells of the body
Cells display “ID cards” on their surface via protein complexes called MHCs
If infected, pieces of virus protein is displayed on the MHCs
A T-cell receptor (TCR) can sense specific pieces of foreign protein, called antigens, when presented on an MHC
When sensed, it kills the cell by injecting poison and setting off suicide pathways
The T cells also activate B cells to make antibodies against the same targets
The antibodies mark the virus for destruction.
T-cells which mistakenly sense normal body proteins are usually killed in an “education” process called tolerance
Examples
T1D: T cells recognize insulin precursors as antigens and kill beta cells
Hashimoto’s thyroiditis: The antigens are Tg and TPO proteins, which are the final stages in production of thyroid hormone. B cells then make anti-Tg and anti-TPO antibodies (which can be identified in blood tests)
Autoimmune T Cells are thought to be errors
Mainstream thought is that self-reactive T cells are errors in the tolerance mechanism
The alternative functional thought: self-reactive T cells play maintenance roles in the body
We explore the idea that T-cells can help to remove hyper secreting mutants
Mis-sensing mutants expand and secrete too much hormone, causing loss of homeostasis
Thyroid cells with mutations in the receptor for their signal (TSH) grow into nodules that secrete too much thyroid hormone;
Beta cells with mutations which make them think there is too much glucose
The mutation rate is about 10-9/ base-pair/division
Autoimmune Surveillance of Hyper-secreting Mutants (ASHM), or autoimmune surveillance for short
T-cells can help to remove mis-sensing mutants
In 4.6, notice how cells producing too many antigens are selectively killed by T-cells
We detect antigens at the very end of the production pathway of the hormone
Autoantigens are pieces of normal proteins or molecules within the body that are mistakenly recognized as foreign by the immune system, leading to an autoimmune response
Diabetes: a major antigen is pre-proinsulin, the very last protein in the production pipeline, which is cleaved to make insulin.
Hashimoto’s: Tg or TPO
The T cells that [mistakenly] recognize pre-proinsulin and other auto-antigens are found in the T-cell repertoire shared by all people called the public T-cell repertoire
T cells can tell the difference in antigen between neighboring cells
Autoimmune surveillance operates on moderate, not strong binding t cells
With very strong binding T cells they would not be able to discriminate between hyper-secreting cells (cells producing LOTS of antigens) and normal cells… bc a single antigen presented on a cell would be enough to bind
Cooperativity (n) is the steep slope we see here…
Like guests quickly filling seats at a party once a few are seated and chatting, positive cooperativity amplifies T cells killing antigens once the first few are identified
This is normally good, but in the case of autoimmune diseases it quickly becomes bad bc T cells kill self-antigens
Mechanisms which help T cells adapt
Regulatory T cells (Tregs) can adapt to a constant antigen level and to respond to exponentially increasing antigen threat
Molecular “switches” on the T cell that make them less active if they kill too often, called immune checkpoints
Relative sensing explains why the T cells won’t aggressively attack an organ that increases hormone production normally but will target individual cells producing significantly more antigen than surrounding cells
Autoimmune surveillance can eliminate any mutant, and can do so without killing too many healthy cells
“Evolutionary Stable Strategy” (ESS): a mechanism in which no mis-sensing mutant cell can invade and outgrow a large population of normal cells.
Ex: No matter what is the “perceived glucose”, the mutant cell has a growth disadvantage compared to normal cells.
Surveillance can descend to autoimmune disease in several ways
Autoimmune disease has a sizable genetic component. But genetics is not all, there is also a stochastic component
How might autoimmune surveillance fail and descend to autoimmune disease? – we don’t know for sure
Theory 1:
Theory 2: Genetic factors like MHC variants can activate B cells to produce antibodies against an antigen
→ Antibodies coat beta cells and act as a “kill me” signal…
Immune cells then attack the beta cells aggressively, thinking that they have viruses inside them
In the aftermath of [a normal] infection, T cells even kill each other in a process called fratricide
In autoimmune disease, cells of the targeted tissue are attacked and killed relentlessly. The killing releases more self antigen, activating more immune cells, making a vicious cycle
Endocrine tissues that rarely get autoimmune disease are prone to diseases of mutant expansion
Autoimmune surveillance theory predicts a tradeoff: if there is little or no surveillance in a tissue, it should get no autoimmune disease. However, it should get diseases of mutant expansion, especially at old ages when mutant cells have had enough time to grow into a large nodule called an adenoma.
A tradeoff seems to exist between two evils: autoimmune disease and diseases of hyper-secreting mutant expansion.
Brief facts about Parathyroid gland
A tiny gland that sits on top of the thyroid
Helps dissolve bone, which is made of calcium phosphate, and to regulate calcium balance from the gut and kidney in order to increase blood calcium
Primary hyperparathyroidism
A hyper-secreting mutant cell pushing calcium levels up at the expense of bones
Symptoms include loss of bone mass and neuronal problems.
Requires surgically removing the adenoma
Afflicts about 1/50 women after menopause (at older age)
Cushing’s Syndrome
Mutants in the pituitary grow into nodules that hypersecrete hormone x2 (ACTH), making the adrenal secrete too much cortisol
Symptoms include depression, hypertension, muscle wasting, and fat distribution in the face and abdomen
Notice only 10% of Pituitary diseases happen because of mutants in the Adrenal. The adrenal is much more susceptible to autoimmune disease than mutant expansion
What rules might determine if a tissue gets autoimmune disease or diseases of mutant expansion?
Theory 1 (weaker, somewhat circular): natural selection
Theory 2 (stronger): the # of mutations for each organ, deducted via weight
Below 1g: mutant expansion disease
The smaller the organ, the fewer cell divisions are needed to make it and the fewer cell divisions occur over life, thus fewer mutations which → less of a need for autoimmune surveillance
Between 1-10g: autoimmune disease
Above 10-30g: cancer
At this rate of cell proliferation, the required levels of autoimmune surveillance would be too high!
Organs thus use stem-cell-based production, in which a single stem-cell division is amplified to make thousands of cells by transit amplifying cells
This reduces the number of mutations that remain in the stem cells of the tissue. But stem cells are more prone to cancer, being cells with high proliferative potential
Chapter 5: Inflammation and Fibrosis as a Bistable System
Introduction
Fibrosis is permanent scars that last a lifetime. Scar tissue replaces healthy tissue and the organ loses function
Occurs in the liver, lung, kidney, heart, and other organs
It’s a major contributor to age-related diseases and is preceded by periods of intense inflammation
No cure for progressive fibrotic diseases other than organ transplant.
Our basic question is how a single biological process, tissue repair, can lead to two very different results: healing or fibrosis
Injury leads to inflammation, which goes to either healing or fibrosis
Injury→ inflammation → fibrosis or healing
The physiological function of fibrosis
If there is a pathogen or a foreign object that cannot be removed, the body tries to encapsulate it in fibrous scar tissue rich with collagen.
As you age, tissues progressively tend to show more fibrosis than healing → organ failure.
There is usually a time window of about 2 days in which stopping inflammation can prevent fibrosis. If the time window is exceeded, fibrosis is inevitable, even if inflammation is stopped.
Multistability – the ability to produce two or more different stable steady states
It can shed light on how inflammation can lead either to healing, if the injury is brief, or to fibrosis
Inflammation includes a massive influx of immune cells and activation of myofibroblasts
Injury to a tissue causes cells to release “alarm” proteins that flow in the blood
The purpose of inflammation is to fight pathogens and to start repair
5 features of inflammation:
Latin rhyme for first four
rubor, calor, tumor, dolor: redness, heat, swelling, and pain.
Dilation of nearby blood vessels to let immune cells flow into the tissue → redness, heat, and swelling
Fifth is loss of tissue function
Macrophages (“big eaters”) - cells that can engulf pathogens and dead cells (M)
Fibroblasts (fiber-forming cells) → myofibroblasts (myo = “muscle-bound”) – helps to contract and close the wound (F)
4 approaches to experiments in systems medicine:
In vivo, in vitro, in silico (computer simulation), and in envelopo (back of the envelope calculations, like we do here)
In envelopo is a name made up by the author lol
Mathematical model for myofibroblasts shows bistability
The middle-fixed point is an unstable fixed point, Fu. To see this, note that if F is smaller than Fu, the proliferation curve is lower
Theoretically, proliferation would go to infinite after Fu, but we introduce a carrying capacity constant into the equation to show Law 2
Fibroblasts sense the density of other fibroblasts and stop growing when they are too dense
Two stable fixed points for the same equation is called bistability
How to read it:
Below an initial level of Fu, F crashes to zero cells; above Fu, F converges to a specific steady-state concentration Fhigh no matter what the starting level was.
Each fixed point (black point) has its own basin of attraction, defined as the range of initial conditions which flow to that fixed point.
Parameters changing F cells
“Pro-F” parameters – the carrying capacity K, autocrine growth factor secretion a and F proliferation rate p1
“Anti-F” parameters - such as death rate d1 or growth-factor removal rate γ1.
Loss of bistability occurs when the ratio of these pro-F and anti-F parameters goes below a threshold
The macrophage-myofibroblast circuit provides two fibrosis states and a healing state
B/c M cells have a very high carrying capacity, M cells require a different mechanism to avoid spiraling out to very high concentrations
Why high carrying capacity?
M cells can increase by tens of folds when inflammation causes a large influx
A basic biological process: the cells that respond to a growth factor also eat it up.
Endocytosis ensures that if there are too many M cells, they eat up their own growth factor and their numbers thus reduce back to steady-state.
Extracellular matrix (ECM or E for short)
Secreted by F cells and destroyed by M cells → E rises with F and drops via molecular scissors produced by M
OFF state: F = M = 0 → it’s a healing state
ON state: E reaches a high steady-state concentration, made by F cells and degraded by M cells. → fibrosis state.
At each point in the plane, we plot a little arrow showing where M and F flow to if they start at that point.
Cold fibrosis is “worse” because there is a lack of M cells with their molecular scissors
→ End stage liver cirrhosis, fibrosis after heart attacks
Dermatology recognizes two main types of scars:
Keloid scars with abundant macrophages (hot fibrosis)
Hyperproliferative scars which eventually lose most of their macrophages (cold fibrosis)
The general condition for stability of such two-cell circuits is
either: (1) both cell types have a carrying capacity or (2) one cell type has a carrying capacity and the other has negative feedback on its growth factor through a mechanism such as endocytosis.
Injury and inflammation can be modeled by transient influx of macrophages
The boundary is called the separatrix.
Past the separatrix, there are enough F and M cells to support each other. They create a scar tissue with constant turnover of M and F cells, and a high steady-state level of fibers E → fibrosis
Above tc, M crosses the separatrix and the ON state is inevitable even if the inflammation stops.
B/c above the separatrix, there are enough F and M cells to promote each other's growth to the next stable point
Thus, the same system can result in either healing or fibrosis, depending on the strength and duration of the inflammation pulse
Bistability can potentially explain other medical situations in which there is a limited time window to prevent irreversible outcomes.
Ex: septic shock, hemorrhagic shock
The long timescale for scar maturation and healing is due to the slowdown near an unstable fixed point
At a fixed point, including an unstable one, the velocity is zero (no change). Thus, the velocity is always slow near a fixed point, causing a slowdown phenomenon.
Strategies for preventing and reversing fibrosis
One does not need to push a parameter all the way down to zero, which is difficult. Instead, one must merely nudge the system below a threshold in order to collapse fibrosis.
Fibrosis seems to be tunable in different biological contexts. Embryos do not show fibrosis after injury, and many mammals regenerate more readily than humans
Part III: Aging and Age-Related Diseases
Chapter 6: Basic Facts About Aging
Aging is defined by the risk of death and diseases that rises with age
Aging has nearly universal features
The Gompertz law is nearly universal. It is found in most animals studied
Variation between individuals increases with age in most physiological functions.
The health of 20-year olds is like a mass-produced poster, whereas 80-year-olds are each an individually crafted work of art.
The frailty index helps us understand in quantitative terms how health declines
Genetically identical organisms die at different times
The risk of death in all organisms is dominated by a large stochastic (random) component
While genetics and environments are important, contrary to popular belief they’re not the most important
Lifespan can be extended in model organisms
A common factor for “longevity mutations” across different organisms is that they lie in pathways which control the tradeoff between growth vs. maintenance.
Nutrition can also affect longevity
Continuous caloric restriction that reduces 30%–40% of normal calorie intake can extend lifespan in organisms ranging from yeast to monkeys
Restricting the time for feeding and restricting certain components of diet.
Lifespan is tuned in evolution according to different life strategies
The disposable soma theory: organisms wield a finite level of biological resources. They face a tradeoff between repairing their bodies (soma) and reproducing. When they are subject to high predation, it’s better for them to invest those resources in rapid growth and reproduction.
Meaning, high extrinsic mortality → more reproductive and less maintenance capabilities
3 archetypal strategies: Shrews, whales, and bats
Live fast die young strategy (Shrews and mice)
Slow life strategy (Whales and elephants)
producing a single offspring at a time and caring for it for a long time.
The protected niche strategy (bats)
Entails the longest childhood training relative to lifespan and the largest brain relative to body mass.
(1) All in all, bigger species tend to live longer… however, (2) Longevity and mass within a species often go against the trend seen between species
(1) Elephants live longer than dogs..
(2) In dogs, for example, tiny Chihuahuas live 15–20 years whereas Great Danes live for 4–6 years.
Molecular Theories of Aging Focus on Cellular Damage
Virtually any form of cellular damage can cause a cell to become senescent, including ROS, DNA damage, shortened telomeres, epigenetic damage
DNA alterations in stem cells can accumulate for decades
Since stem cells stay in the body throughout life, and all cells mutate, they run the risk of gaining mutations and other changes in their DNA.
Some mutations lead to changes in genes that don’t harm the stem cells but affect the differentiated cells, D
Generally, the shorter the lifespan the faster mutations accumulate.
Malls have an effective rate of mutation accumulation of 1/lifespan
Damaged and senescent cells bridge between molecular damage and tissue-level damage
Senescent cells are cells that have stopped dividing but remain metabolically active
When organisms are injured, cells sense that they have been damaged. If they keep dividing, they run the risk of becoming cancer cells. However, if all injured cells kill themselves, the tissue will have a hole
A senescent cell maintains tissue integrity without the risk of cancer.
Senescent cells secrete senescence-associated secretory phenotype, or SASP
Dark side of senescent cells
Too much SASP in the body → chronic inflammation… aka inflammaging
Inflammaging drives nearly all age-related diseases including osteoarthritis, diabetes, Alzheimer’s disease and heart disease.
Removing senescent cells in mice slows age-related diseases and increases average lifespan
Senolytics: selectively kill senescent cells
Accumulation of senescent cells is not the only cause of aging but we will assume they are the dominant cause
We will also make the simplifying assumption that senescent cells are a single entity, even though they are heterogeneous and tissue-specific.
Chapter 7: Aging and Saturated Repair
A theory for aging based on saturating removal of damage
A story about trucks to build intuition
A young organism is like a small village where each house produces garbage. The village has 100 garbage trucks, more than enough to clear the garbage. Every year a new house is built and with time the village grows. It eventually becomes a big city that produces a lot of garbage every day. However, this village was not designed to be so large, so there are still only 100 trucks. But now the trucks are overloaded, and garbage piles up in the streets. Any extra garbage stays around for a long time until the overwhelmed trucks get to it. Eventually, when garbage is produced at a rate larger than the maximal capacity of the trucks, garbage piles up higher and higher. The situation becomes incompatible with life.
Houses are damage producing units, in animals they are stem cells
They produce damaged differentiated cells that become senescent.
They’re not removed but the garbage they create is
The trucks are NK cells and macrophages.
NK cells attach to the senescent cells and inject toxic proteins to kill them.
Macrophages swallow up the remains of the killed cells
It may be enough to have only 1/1000 cells become senescent for their secreted factors to affect physiology at large.
Nutshell of the theory
(1) All cells come from cells
Stem cells produce differentiated cells
(2) Cells mutate
Epigenetically altered stem cells increase linearly with age, and produce damaged and senescent cells
(3) Biological processes saturate
The removal processes of these damaged and senescent cells eventually reach their maximal capacity and saturate. Damaged/senescent cell levels rise sharply leading to inflammaging and decline.
Natural selection is the driving force of these, from the disposable soma theory bc damage removal was selected for the young not the old, hence it doesn’t increase with age
Senescent cell dynamics in mice can test the model
Senescent-cell dynamics are tightly linked with the diseases and conditions that make up the frailty index.
The saturating removal model can explain senescent cell dynamics
The saturating removal model is the truck analogy we had before
Lifespan can be extended by:
(1) Increasing the repair capacity β
(2) Reducing the senescent-cell production rateη
More trucks or slower construction of houses extend longevity
Adding noise to the model explains the variation between individuals in senescent-cell levels
White noise (ξ) is a convenient way to wrap up our ignorance in a mathematical object that we can work with.
The noise could describe fluctuations in production and removal due to internal or external reasons such as injury, infection, stress (cortisol), and variations in sleep
The saturating removal model captures the variation between individuals
Visualizing the bowl
Think of the damage in cells as a particle in a bowl. When we’re young, the particle (representing damage) stays near the bottom because the bowl is steep and keeps it in place.
As we age, the bowl becomes wider and less steep. This means the particle can move more freely and can get further away from the center, representing more accumulated damage.
Noise and movement
“Noise” represents random fluctuations that jostle the particle around in the bowl. In young individuals, these fluctuations are small, keeping the damage low and stable.
With aging, the noise has a bigger effect because the bowl is wider, leading to more variation in damage.
Production vs removal of damage
Cells produce damage over time, but they also have mechanisms to remove it.
When young, these removal processes are efficient, keeping damage low.
As we age, the efficiency drops, and the removal can’t keep up with the production, leading to higher damage levels.
Gompertz mortality with slowdown is found in the model
2 questions
Why do genetically identical organisms die at different times?
What explains the exponential increase in risk of death with age (the Gompertz law), and the deceleration at very old ages?
Crossing the threshold represents a collapse of an organ system or a tipping point such as sepsis
Modeled after Kramer’s equation in the field of stochastic processes
Increased age → the potential bowl opens up → risk therefore rises exponentially with age
TL;DR
Genetically identical mice die at different times due to noise amplified by accumulating damage producing units and a saturating damage removal.
The human Gompertz law is captured as well
The saturing removal model explains aging patterns also in organisms that lack senescent cells
The model is agnostic about the molecular nature of the damage X and the damage-producing units
It can therefore be generalized beyond senescent cells. It should apply to any form of damage that is causal for aging as long as it has saturating-removal-type dynamics, namely production rate that rises linearly with age and saturating removal
Rapid shifts between hazard curves
The life-extending diet slows the rate of living and shifts the tradeoff from growth to repair
It’s as if the denizens of the houses begin to conserve, reuse, and recycle and thus produce less garbage.
When recycling begins, the trucks clear the excess garbage rapidly
The change in slope from temperature change can be explained by a reduced rate of production of new damage producing units but with no change in amount of damage produced
Slower construction of new houses but the houses all output the same amount of garbage
Scaling of survival curves
Scaling means that the survival curves collapse on the same curve when age is scaled by mean lifespan.
A good data collapse is where different curves fall on top of each other when normalized
Why does caloric restriction extend life span across organisms?
It reduces the rate of damage production by slowing down metabolic activity, and shifting the cells into increased repair and recycling
→ it should reduce the rate of DPU production and toxicity per DPU, reducing η.
Why might inducing the growth of blood vessels help reduce aging?
It’s like having more and bigger roads for the trucks
Access for immune cells that remove senescent cells, thus increasing removal rate
We can do this via reducing glucose spikes that damage blood vessels (ketogenic diet, diabetes drug acarbose)
Approaches to slow down aging and aging-related diseases
Current medicine treats age-related diseases one at a time: diabetes, cancer, heart disease, and so on
These aren't the bottleneck, they're the side-effects
Geroscience hypothesis: slowing the core process of aging will prevent and mitigate multiple age-related diseases in one fell swoop
(1) Reduce production rate η or (2) increase removal capacity β.
Approaches from Reduce production rate η
Caloric restriction
Fasting shifts the balance from growth toward maintenance in cells
Other types of restricted feeding
Developing drugs that mimic caloric restriction by, for example, perturbing the IGF1 pathway; these drugs include mTOR inhibitors.
A current effort is to convince the federal food and drug administration (FDA) to allow clinical trials for aging; currently only trials for specific diseases are allowed
Increasing removal rate of senescent cells via senolytic drugs
One such drug iinhibits an anti-cell-death pathway called Bcl2, exploiting the fact that this pathway helps senescent cells resist death to a greater extent than most other cells in the body.
Approaches from increase removal capacity β.
CAR-T approach:
killer T cells are taken from the mouse and genetically engineered to express a receptor that recognizes a protein found only on the surface of senescent cells.
Non-pharmacological approaches
Exercise, healthy diet, good sleep and reduced stress by means of social relationships, purposeful action, psychotherapy, meditation, and moderation.
Exercise has coordinated beneficial effects such as lowering insulin resistance and reducing excess fat in tissues.
Healthy diet likewise reduces fat and insulin spikes.
Easing the mind reduces stress including the activity of the HPA axis and sympathetic nervous system.
This positively impacts insulin resistance and blood pressure and enhances the maintenance roles of the immune system.
Targeting altered stem cells (the root) via targeting epigenetic changes is very hard
Blood health depends on the luck of which mutations these stem cells happen to have
Chapter 8: Age-Related Diseases
Introduction
Incidence is the probability to get the disease at a given age
It is calculated by considering 100,000 people without the disease at age t and asking how many will be diagnosed over the following year.
The incidence of age-related diseases rises exponentially with age and drops at very old ages
We need to understand why age 20 is different from age 70 in ways that make these diseases so much more likely.
We will also understand why incidence drops at very old ages.
Diseases caused by threshold crossing of senescent cells have an exponential incidence curve
Diseases of old age are due to a phase transition in which aging pushes a parameter of a physiological circuit across a threshold.
Once the threshold is crossed, cells grow without control as in cancer or die without control as in degenerative diseases.
Disease threshold model- disease occurs when senescent cells cross a threshold that is specific for each disease
Ech individual crosses the threshold at different times, due to the stochastic nature of the dynamics of senescent cells.
Decline of incidence at very old ages is due to population heterogeneity
Only a fraction φ of the population are t
At very old ages, most of those that are susceptible have already had the disease. This results in the decline in incidence rate.
The model describes well the incidence curves of age-related diseases
The model does not describe well the incidence of several age-related diseases
Osteoporosis and Alzheimer’s, for example
Alzheimer’s disease and dementia
Dementia may have its own saturating-removal dynamics
The brain is a protected organ with its own version of immune function.
Might be accumulation of prion-like protein aggregates in neurons which saturate their mitochondrial-based removal systems.
Steeper incidence curves begin lower
Recall the analogy with a particle in a potential well: a high threshold makes it exponentially harder for noise to generate enough senescent cells to cross the threshold at young ages
Remaining questions
How does each specific disease occur when senescent cells cross a threshold?
How to link senescent cells and the physiology of each disease?
Cancer incidence curves can be explained by threshold crossing of tumor growth and removal rates
Cancer cells arise continuously in the body due to accumulation of mutations. If conditions are right, the mutant cells grow faster than their neighbors. These cancer cells are removed by immune surveillance, primarily by the innate immune cells such as NK cells and macrophages, and at later stages by adaptive immunity including T cells. If the cancer cells manage to grow beyond a critical number of roughly 106 cells, they organize a local microenvironment that can prevent further immune clearance.
The main cells that remove early cancer cells, NK cells and macrophages also remove senescent cells. They become saturated when senescent cells become abundant and cannot keep up with the demand for cancer removal services.
Cancers is like an AND-gate between chronic inflammation and oncogenic mutations.
Inflammation reduces the growth rate of healthy cells, giving mutant cancer cells a relative growth advantage.
Genetic and environmental factors increase the probability of sporadic occurrences of the cancer cells in the tissue.
Many infectious diseases have age-related mortality
The disease-threshold model can be used to make connections between very different diseases
Infections become deadly when they grow exponentially (when proliferation > removal)
Senescent cells overload the immune cells, including NK cells and macrophages, whose job is to fight pathogens. They also contribute to the decline of the adaptive immune system, including T cells, with age.
A theory for IPF, a disease of unknown origin
Idiopathic pulmonary fibrosis
“Idiopathic” means disease of unknown cause, “pulmonary” means lungs, and “fibrosis” means excess scarring.
No cure, patients often die within 1–3 years
The alveoli let oxygen from the air go into the blood and let CO2 out.
IPF scarring occurs in the interstitial layer around the alveoli (Figure 8.12).
Stem cells must self-renew and supply differentiated cells
Stem cells are found in organs that need to generate large numbers of cells (aka need to be replaced more often). One class of such organs are barrier organs exposed to the outside world, like the lung, intestine, and skin
We covered self renewing cells earlier in the book
“Front-line tissues” have stem cells and differentiated cells which are both exposed to damage, such as air particles, pathogens, and the mechanical stress of breathing
Incidence of idiopathic pulmonary fibrosis can be explained by stem-cell removal exceeding proliferation
Such a threshold for failure is less of a concern in the circuit for protected stem cells, which have low stem-cell removal rate
Susceptibility to IPF involves genetic and environmental factors that increase stem-cell death
Genetic: First-degree relatives of a patient have a 5-fold higher risk of contracting IPF.
Two classes of gene variants that increase the risk of IPF.
Surfactant genes expressed by S cells
Damaged surfactant genes produce unfolded surfactant proteins that damage the stem cells and increase their removal rate
Telomerase genes
Telomerase allows them to divide indefinitely, by restoring their telomeres after each division.
Damaged telomeres increases death rate of stem cells
Environmental: smoking doubles the risk of IPF
At the outside of the lung, the mechanical stress on the alveoli, and hence removal rate, is highest. Thus, fibrosis begins at the outside of the lung, and then progresses inward
IPF is mathematically analogous to another age-related disease, osteoarthritis
Osteoarthritis, a common condition that occurs in about 10% of those over 60
The protective cartilage that cushions the ends of the bones wears down over time
No cure except joint-replacement surgery
Environmental risk: being overweight (high BMI); Genetic: 50% heritability
The joint is made of a tough fibrous cartilage
Chondrocyte cells (D) are made by stem-like progenitor cells
They make the fibers for strength and elasticity, including collagen-2
The progenitor cells in the joint are at the front line, just like in the alveoli.
Cells have limited mobility through the cartilage, and thus S cells need to be close to where new D cells are needed, namely at the front line.
The joint suffers mechanical stress, especially in regions that support the body’s weight
In the young, this stress doesn’t do much and the joints are fine for 50 or more years
People with knees that bend inward or outward have the damage at the appropriate side of the knee where load is highest.
As we age, the stem cells make tougher fibers than in normal cartilage, such as collagen-1 instead of collagen-2, making the tissue stiffer and less elastic
→ As a result, cracks form, leading to a hole that often goes right down to the bone.
Generalized mathematical analogy
Stem cells are challenged with a high removal rate because they are at the front line. The removal rate varies across the organ and is highest where the most pressure occurs. Reducing the proliferation rate of Stem cells down toward their removal rate leads to a rise in the stem-cell fraction S/D and eventually the cells are lost altogether. This reduction in S proliferation can be caused by SASP secreted by the senescent cells in the body, as well as local senescent cells in the join
Cancer and infectious disease both involve exponential growth when proliferation exceeds removal. Progressive fibrotic diseases occur in the opposite transition, an exponential decline of cells when proliferation of front-line stem cells drops below their removal.
Removing senescent cells can rejuvenate the incidence of age-related diseases by decades
Note: I believe this has yet to be tested on humans. Only mice. These predictions are via simulations
Notably, rejuvenation is predicted even when treatment begins at old ages
Treating aging itself rather than healing one disease at a time can be a possible turning point in medicine
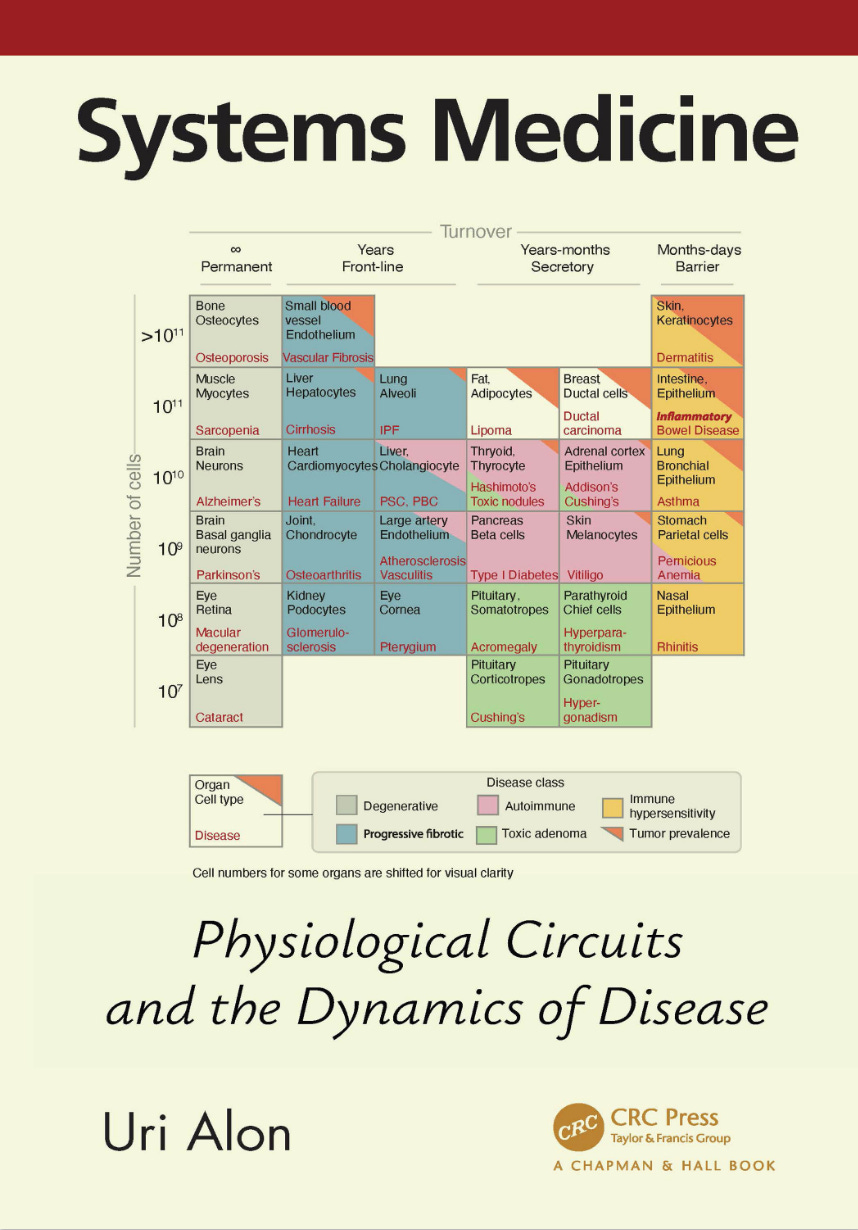
Chapter 9: Periodic Table of Diseases
Periodic Table of Diseases
The metaphor is imperfect. For example, it won’t be a periodic table (no repeating period). But there will be patterns and predicted diseases
Cells types can be classified by abundance and turnover
Four traditional ways to classify diseases
(1) anatomically, by organ or tissue, such as heart diseases and liver diseases
(2) physiologically, by function, such as respiratory diseases and metabolic diseases
(3) pathologically, by the nature of the disease process such as neoplastic diseases (tumors) and inflammatory diseases
(4) etiologically, by their cause, such as fungal or streptococcal infections.
This book proposes a new classification inspired by the physiological circuit motifs we have studied. The circuits describe the dynamics of cell numbers and cell turnover.
Every “element” in the table is thus a cell type… thus, this table considers cell-type-specific diseases
A billion cells weigh about a gram
Exceptions are large cells like neurons, fat cells, and muscle cells which are each 100 times bigger than most cells, so that the 1 kg brain has about 1010 neurons.
Cell turnover time on the x-axis and # of cells / weight on the y-axis
Turnover is determined by function… barrier cells like skin need to replace often whereas neuron circuits are permanent bc they do not need to replace neurons
The table shows broad patterns of diseases
It is a working draft for us to see patterns
Cancer risk rises along the diagonal of the table
The main effect is the total number of cells, but also exposure to toxins and mutagens
Hence the risk is highest on the top right, where barrier tissues are exposed to factors that cause mutation and inflammation such as UV in the skin or smoking in the bronchi of the lung
Secretory cells show three zones: toxic adenomas, autoimmune diseases, and cancer
Below 1g (~109 cells) – toxic adenomas
Because there are so few cells, there is a low probability for hyper-sensing mutants during reproductive years, and even lower probability for the multiple mutations needed for cancer.
The strategy is therefore “let it be”
Cost: risk of hyper-secreting adenomas at old age.
Between 1g and 10g (~109 to 1010 cells) – autoimmune diseases
There are more cells now, so to avoid hyper-secreting adenomas, the body uses self-attaching T cells (autoimmune surveillance) to kill the hyper-secreting cells
Cost: autoimmune disease with a young age of onset in a fraction of the population.
Above 10g (>=1011 cells) - cancer
Accumulating mutations in the stem cells, which can divide infinitely, can cause cancer
The three-zone pattern can be explained by circuit motifs
The periodic table explains autoimmune diseases of non-endocrine cells
Non-endocrine cells are cells that do not secrete hormones.
Permanent tissues have degenerative diseases of failed maintenance
Incidence of degenerative disease depends strongly on age, not organ size
Barrier tissues exhibit immune hypersensitivity diseases
Barrier functions are modulated by the immune system by means of signal molecules called cytokines
When this regulatory feedback goes wrong, immune hypersensitivity diseases occurs
Ex: Skin thickness is increased when regions are repeatedly bruised → psoriasis
Comorbidity - susceptibility to these diseases often occurs in the same individual
Atopic triad – asthma in the bronchi, dermatitis in the skin, and atopic rhinitis in the nose
Infectious diseases occur mainly in barrier tissues
Include ones that have a well-defined cell type as the first site of infection, exclude ones that can affect many organs
High-income countries tend to not have death from communicable diseases.
Front-line tissues get progressive fibrotic diseases of old age
These tissues have structures that do not allow them to protect their stem cells. Thus stem cells are removed and damaged as often as differentiated cells
In contrast to acute injury, progressive fibrotic diseases often don’t have a clear source of extrinsic damage.
Fibrotic diseases often raise the risk of cancer, as in the liver and pancreas, because they supply half of the AND gate: chronic inflammation.
Circuit motifs underlie disease patterns in the table
Age of onset and lifetime risk shows patterns in the table
Onset age drops from left to right
Predicted diseases in the table
Epilogue: Simplicity In Systems Medicine
Simplicity in structure
Function 1: organ size control
The secrete-and-grow circuit motif binds cell growth and cell function in the same signal, thus locking cell population into a size that provides proper function
In the stem-cell feedback motif, feedback from differentiated cells enhances the rate of differentiation, to keep both stem cells and differentiated cells in homeostatic balance
Function 2: robustness to variations in physiological parameters
Basic circuit motifs are sometimes wired together to produce larger circuits
Ex: HPA and HPT circuits
The larger circuits also have new features, including oscillatory responses on the timescales of months.
Simplicity in models
The models require only information on whether X activates or inhibits Y, and at what threshold.
Phase portraits and rate plots
Graphical tools like phase portraits and rate plots provide a back of the envelope sketch of the behavior and its dependence on parameters.
Bifurcations
We can deduce the existence of bifurcations in which the system changes behavior all at once
Separation of timescales
Circuit motifs combine slow cell growth on the scale of days to months with much faster molecular signals that work on the scale of minutes to hours.
Simplicity in etiology
Disease occurs when the protection mechanism fails because a parameter crosses a threshold, taking the circuit beyond its design specifications
Often the change is from stability of cell populations to instability – cell numbers shrink (degeneration, progressive fibrosis) or grow (tumors).
Mutant resistance mechanism 1: biphasic control
Programs the cells to kill themselves if their input signal is too high, with the logic that mutant cells that mis-sense the signal are thus eliminated.
Mutant resistance mechanism 2: surveillance by self-reactive T cells.
The T cells act as a police force that can weed out hyper-secreting mutant cells. In certain individuals, this surveillance can tip into self-perpetuating autoimmune disease.
Some experimental areas:
Experimental areas induced by circuit-level theories presented in this book:
Using hot and cold fibrosis to analyze new tissue samples
The support system for cancer composed of F and M cells
Finding mutations or interventions that do not scale in the saturating-removal model (related to the survival curve) can help to pinpoint the equivalent identity of the NK cells/macrophages and senescent cells in each organism